October 24, 2019, 6:52 am
Telerik UI for ASP.NET AJAXIncludes updates to AsyncUpload and PdfProcessing.
Features
- AsyncUpload
- Whitelisting of custom upload metadata types.
- Improved Telerik.Web.DisableAsyncUploadHandler behavior.
- PdfProcessing
- Implemented support for importing widget annotation with Kids property.
Fixes
- Common
- Missing checkboxes in Firefox 65+
- Calendar
- RadCalendar and picker controls throw a JS error when animation duration is set to zero 0
- Editor
- Improve XSS filtering
- Track changes does not mark - hyphen/slash/minus symbol
- Input
- Uncaught TypeError: Cannot read property '_popupButton' of null Error thrown when clicking Ok or Cancel buttons of DatePicker's fast navigation
- ListBox
- Disabled ListBox and TreeView cannot be scrolled in IE because its scroll is disabled too
- MediaPlayer
- MediaPlayer throws 'mimeType' error in case youtube playlist is used
- PdfProcessing
- InvalidCastException is thrown when importing a document with an empty PDF name object.
- InvalidCastException is thrown when importing widget annotation with Kids property.
- SearchBox
- Show Tooltip of RadSearchButton
- SkinManager
- Loading custom skins trough RadSkinManager -> Skins -> SkinReference.Path does not work correctly
- Slider
- Last item drops on a new line under Firefox on large scale monitors
- SpreadProcessing
- The formula in list data validation rule's argument is replaced with culture-dependent list separator and later treated as text.
- Wizard
- Inconsistent buttons rendered when RadWizard is nested in RadWizard
- WordsProcessing
- NotImplementedException is thrown when importing DOCX containing charts.
↧
October 24, 2019, 6:53 am
Telerik DevCraft UIIncludes new features in SyntaxEditor, GridView, VirtualGrid and more.
Features
Telerik DevCraft UI includes the following updates:
↧
↧
October 24, 2019, 6:57 am
Telerik DevCraft UltimateIncludes new features in SyntaxEditor, GridView, VirtualGrid and more.
Features
Telerik DevCraft Ultimate includes the following updates:
↧
October 24, 2019, 6:58 am
Kendo UIAdds Merge and Split tools for table cells in Editor.
Features
- Editor
- Merge and Split tools for table cells.
Fixes
- Calendar
- Calendar - Calling setOptions will break multiple selection support
- ComboBox
- Change event is not triggered, if text() method is used, and when Clear button is clicked to clear the selection
- Click on associated Label with ComboBox, Multiselect and MultiColumnComboBox does not focus the input
- Common
- Invalid animation value in kendo.common-material.css
- DatePicker
- DatePicker calendar is not refreshed after clearing value in picker
- DateTimePicker
- DatePicker calendar is not refreshed after clearing value in picker
- The popup.appendTo option is missing for the TimeView popup
- Draggable
- Difficulty grouping a grid with a touch and mouse device
- Editor
- Editor adds an empty paragraph on pasting text in nested table
- Tooltip property does not change title of Editor's Format tool
- Overlapping buttons in RTL Editor with resizable toolbar
- Not aligned tools in inline Editor toolbar in RTL
- Displaced inline Editor toolbar drag handle and overflow button
- Grid
- Sortable settings are missing from the MVC wrapper
- Aggregates are not calculated correctly when dataSource.inPlaceSort is enabled
- Grid editing in InCell edit mode does not accept new values on mobile devices
- Grid.pageable.alwaysVisible=false make the pager appear by default and disappear when it's not needed.
- Difficulty grouping a grid with a touch and mouse device
- Wrong column is auto-resized after auto-resize and columns reorder is performed
- autoFitColumn() does not calculate properly the width of the first Grid header to be collapsed in Safari
- autoFitColumn() does not calculate widths properly on IPad when there are icons in the header
- Grid should measure group and hierarchy columns' widths when showing and hiding other columns
- Map
- Map layer show method attaches the same event handlers multiple times
- MobileListView
- Mobile ListView it does not scroll in iOS13
- MultiColumnComboBox
- Click on associated Label with ComboBox, Multiselect and MultiColumnComboBox does not focus the input
- MultiSelect
- MultiSelect selected tags cannot be removed through tag's delete button in iOS 13 Safari
- MultiSelect with autoBind false replaces its value with the one set in its options
- Readonly state is not removed from Kendo MultiSelect on calling the readonly method
- Click on associated Label with ComboBox, Multiselect and MultiColumnComboBox does not focus the input
- PDFViewer
- Memory Leak in Kendo PDFViewer when loading files.
- PDFViewer download does not work in iOS 13
- Wrong scroll position of PDF file content on paging through PDFViewer's Pager and jQuery 3.4.1
- Search dialog throws an error with jQuery 3.4.x
- Unable to download PDFViewer's PDF file on iOS
- PivotGrid
- PivotGrid Configurator messages should not be draggable
- QRCode
- QRCode appears squashed when drawn as canvas
- Scheduler
- Scheduler cannot be scrolled in iOS 13 with Chrome
- Scheduler moveStart event does not trigger on mobile devices
- Scroller
- Mobile Application with nativeScrolling does not scroll on device with iOS 13.1
- Spreadsheet
- Spreadsheet ColumnHeaderMenu does not open on frozen column header right-click
- Databound Spreadsheet loses data on inserting a header row
- Spreadsheet Text and Background custom color popups are cropped
- Spreadsheet does not alert the user when trying to sort Range with merged cells
- Flickering custom cell editor for Spreadsheet column with configured filtering / sorting and SASS themes in Chrome and FF
- TreeList
- Treelist horizontal scroll disappears when no items available
- Upload
- Smaller than expected height of not async Upload in Office365 theme
- Window
- Window animation duration option is not applied correctly
- Window title method does not remove the wrapper padding
↧
October 24, 2019, 6:59 am
Telerik DevCraft CompleteIncludes new features in SyntaxEditor, GridView, VirtualGrid and more.
Features
Telerik DevCraft Complete includes the following updates:
↧
↧
October 25, 2019, 7:18 am
Conditional Formatting Filters Grid adds conditional formatting filters.
Features
Data Grid and TreesList
- Conditional Formatting Filters - You can now easily filter data based on the Conditional Formatting rules defined for a column. Both the Filter Editor and the Excel-Style Drop-Down Filter can display available rules and indicate the number of records that meet rule conditions. You can also create a dedicated Filter Element for Conditional Formatting filters.
- Data Analysis Filters - The Data Grid and TreeList allow you to apply the following data analysis filters:
- Top N
- Bottom N
- Below Average
- Above Average
- Unique
- Duplicate
- The Filter Editor and the Excel-Style Drop-Down Filter display the corresponding operators in their operator lists.
- Search Panel - New Parse Modes
- Exact - the search engine does not split the query into individual words and thereby searches for exact matches.
- Or - words in the search query are combined with the OR operator.
- And - words in the search query are combined with the AND operator.
- Excel-Style Drop-Down Filter Enhancements - The new Excel-Style Drop-Down Filter is now used in the Data Grid and TreeList by default. It includes various performance and stability enhancements and can now work with server-side data provided by Server Mode, Instant Feedback, or Virtual sources.
- Summary for Selection - The WPF Data Grid and TreeList can now calculate summary values for selected rows or cells. You can enable this functionality for all group and total summaries or create individual summary items for selected rows/cells (in addition to standard totals).
- Edit Entire Row - The WPF Data Grid and TreeList introduce a new edit mode that displays Update and Cancel buttons for an edited row. In this mode, your changes are not posted to the data source and you cannot navigate away from an edited row unless you press the Update or Cancel button.
- Filtering UI Server Sources Support - The new Filter Editor, the Excel-Style Drop-Down Filter, and Filter Elements can work with server-side data provided by Server Mode, Instant Feedback, or Virtual sources.
Charting
- Waterfall - This release includes a new Waterfall chart type. Waterfall charts can help visualize positive and negative changes to values across a given time period.
- Scrollbar Annotations - With scrollbar annotations, you can direct users to important information within the XY diagram. Provides annotations for the following chart elements:
- Strips
- Constant Lines
- Pane Annotations
- Series Point Annotations
- Custom Axis Labels
- You can enable/disable scrollbar annotations for specific chart elements.
- Box Plot - This release includes a new Box Plot chart type. Box Plot charts help you visualize data distribution across a six number summary (minimum, first quartile, median, third quartile, maximum and mean). Any data not included between minimum and maximum values are plotted as an outlier with a small circle.
- TimeSpan Axis Scale Support - v19.2 introduces full support for TimeSpan scales. You can plot your TimeSpan data as-is or specify a custom aggregation mode. TimeSpan data can be mapped to an X-Axis, Y-Axis or both.
- XY-Diagram Performance Improvements - Real-Time Data Updates - v19.2 optimizes the XY-Diagram layout calculation engine, which results in high refresh rates and smooth visualization when handling very fast-changing datasets. See the following chart for performance measurements compared to v19.1.
Diagram
- Org Chart Layout - The new Org Chart automatic layout algorithm visualizes roles and relationships within an entity such as a company department. Shapes at the upper levels of the hierarchy are arranged using the "tree graph" algorithm. The number of levels in the tree section is specified by the OrgChartLayoutTreeLevelCount property. The lower levels of the hierarchy are arranged using the "tip-over" tree layout algorithm.
- Connector Labels - With this release, you can add up to four text labels to connectors. You can add two labels at the start point and two labels at the end point. New API includes:
- BeginLeftLabel / BeginRightLabel
- EndLeftLabel / EndRightLabel
- BeginLabelArrowOffset / BeginLabelConnectorOffset
- EndLabelArrowOffset / EndLabelConnectorOffset
- Printing - Fit to Page - You can now scale a diagram and fit it onto a single page or a fixed number of pages when printing. To scale a diagram in code, use the new overloads of the Print, QuickPrint, and PrintToPdf methods. These allow you to specify the orientation and number of pages used to fit the diagram. End-users can set these options within the Print Preview window.
New Badges
- The new Badge API allows you to display badges over any control or UI element, be it a data grid column or Toolbar/Ribbon item. You can specify badge position, content, and appearance.
Data Editors
- Time Picker - This release includes a new Time Picker control. This control can be used as a standalone time picker, or you can seamlessly embed it within the DevExpress DateEdit control.
- Read-Only State - With this release, data editors in a read-only state are visually distinguished from those that can be edited. This feature is available when using Office 2016 SE, Office 2019, and VS 2017 themes.
- Miscellaneous Enhancements
- You can substitute the selected value in the AutoSuggestEdit control using the new SuggestionChoosing event.
- ButtonEdit descendants can now display a loading indicator within their text box when a time consuming operation is performed.
- Editors can display null text when they are focused.
- The new CheckEdit.Toggle method allows you to change the CheckEdit control's checked state.
Docking
- MVVM Enhancements
- Layout Groups now offer ItemTemplate and ItemTemplateSelector properties. This allows you to build complex layouts with nested groups and panels based on source objects from your ViewModel without defining groups in the UI.
- Groups and panels generated from the LayoutGroup's ItemsSource now support all Docking operations. They can be reordered, removed, made to float or docked into other groups.
- The DockLayoutManager no longer removes Layout Groups with the specified ItemsSource from its group collection. When a user closes all panels in such a group, the group remains hidden and appears again if its ItemSource collection is updated.
Gantt
- Strip Lines - The DevExpress WPF Gantt control supports 3 strip line types:
- StripLine - a single strip line that marks a particular date and time range.
- StripLineRule - allows you to mark multiple date and time ranges based upon a specific rule.
- CurrentDateTimeStripLine - displays a strip line that points to the current date and time and updates it on-screen in real time.
- You can add strip lines manually or retrieve them from a data source (or View Model).
- Critical Path - The Gantt Control can now automatically calculate and highlight critical paths in the Gantt area. A critical path will automatically update whenever you move tasks or change the task's duration.
- Edit Events - This release adds a set of events designed to improve control over end-user actions made within the Gantt area. These events allow you to do the following:
- Snap edited date-time values (task start date, finish date, and duration) with any step.
- Provide visual feedback: highlight tasks that can be linked by an edited connector.
- Cancel any end user edit action.
Map
- Heatmap Data Provider - v19.2 includes a new cartographic visualization option – a heat map. To create a heat map, use the new data provider (HeatmapProvider) linked to geographical point data (latitude and longitude) and define the heat map color schema using ChoroplethColorizer. You can also change the following heatmap options: color gradient, opacity and data point radius.
- In-Memory Image Tile Provider - The ImageTileDataProvider allows you to display custom tile images without saving them locally. You can load image tiles created at runtime from almost any source. To do this, create a bitmap for each tile based on its indices.
- Gradient Mode for ColorScaleLegend - This release includes a new EnableGradientScale property. Set this property to true and create a gradual blend between legend color items.
Navigation
- Navigation Frame - API Enhancements
- The new Navigation.SaveToNavigationJournal attached property allows you to save information about specific navigation steps to the navigation journal.
- The new NavigationFrame.NavigationCanceled event fires when navigation is canceled in the NavigationFrame.Navigating event handler.
- Ribbon and Toolbar items now support attached properties.
- Breadcrumb History - Like the Windows File Explorer, the Breadcrumb control can now log navigation history and display recently accessed nodes in its drop-down window.
- Accordion Control Enhancements
- Bind to ICollectionView Sources - allows you to manipulate the current record and define rules for filtering, sorting, and grouping.
- Unregister any key gesture within the Accordion control using the ClearHotKeys method.
Pivot Grid
- Aggregation at Any Level - This release includes an optimized Pivot Grid calculation engine for WinForms, WPF and ASP.NET. This new engine provides a more versatile summary expression function. The scope of the function is unbound fields. The Aggr function aggregates data with a specific summary function against a specific set of dimensions. Aggr functions can be nested as needed (you can easily create the desired aggregation level within the Pivot Grid control). The Aggr function has the following syntax: Aggr(summaryExpression, dimension1, dimension2, ...). The first argument is a summary expression calculated against a data source field. It is followed by a set of dimensions whose values are grouped to calculate summaries for the first argument.
- Window Calculations - You can now specify the following window calculation options:
- Running Totals
- Moving Calculation
- Rank
- Difference
- Percent Of Total
- Custom Window Expression
- The new object model includes the following classes:
- RunningTotalBinding
- MovingCalculationBinding
- RankBinding
- DifferenceBinding
- PercentOfTotalBinding
- WindowExpressionBinding
- These enhancements are available when the new Optimized calculation engine is activated.
- Direct Data Access in Client Mode - The data engine loads data to local in-memory storage. This local storage is optimized for frequent calculations with typed data sets and guarantees data integrity. Some large data sets, however, may require require too large a memory footprint (which can, in turn, slow down an application). This release adds a DirectDataAccessInClientMode option. When the DirectDataAccessInClientMode option is enabled, the calculation engine does not upload source data to temporary storage. This avoids performance degradation in Client mode when working with large volumes of data (and when frequent re-calculations are unnecessary). This option cannot be used if using the PivotGrid in Legacy mode.
- Excel-Style Drop-Down Filter Enhancements - The new Excel-Style Drop-Down Filter is now used in the Pivot Grid by default. It includes various performance and stability enhancements and can now work with server-side data provided by Server Mode.
Rich Text Editor
- Hyphenation - The WPF Rich Text Editor now supports soft hyphens and automatic hyphenation. You can load, print and export documents with soft hyphens. End-users can insert hyphens via Ribbon UI or the Ctrl+- shortcut. You can also enable automatic hyphenation. To do that, link a dictionary that specifies hyphenation rules.
- Track Changes - The Rich Text Editor allows you to use Track Changes to make revisions in a document. You can access, accept or reject changes in code. New UI elements allow you to enable change tracking and display revisions. Documents with revisions can be printed and exported to PDF.
- Theme Font Support - The Word Processing Document API and WinForms / WPF Rich Text Editors support theme fonts. A document theme contains two sets of fonts (Headings and Body) for the entire document. Each set includes font names for different languages.
Scheduler
- Time Regions - Time Regions allow you to selectively highlight certain timeframes (time cells). Time Regions have the same recurrence settings as appointments and can be Resource-specific.
- Appointment Edit Events - New events offer extended control over appointment editing. These events include:
- AppointmentAdding
- AppointmentAdded
- AppointmentRemoving
- AppointmentRemoved
- AppointmentEditing
- AppointmentEdited
- AppointmentRestoring
- AppointmentRestored
- Appointment Resize Events - New events include:
- StartAppointmentResize
- QueryContinueAppointmentResize
- ResizeAppointmentOver
- CommitAppointmentResize
- CompleteAppointmentResize
- API Enhancements
- The new RecurrenceBuilder class allows you to create recurrence patterns in code-behind using a Fluent API style. It comes with a set of markup extensions to create the same recurrence patterns in XAML.
- The new SchedulerControl.ToolTipMode property allows you to display a tooltip instead of the default appointment flyout.
- The new brush-based colorization mechanism provides simpler and more flexible customization of labels, status, and resource data. (Learn More)
- Scheduler View properties can now disable the highlighting of non-working hours and even/odd months. These properties are: DayViewBase.HighlightNonworkingHours, MonthView.HighlightEvenMonths, TimelineView.HighlightNonworkingHours.
Spreadsheet
- Excel Binary Workbook (XLSB) Support - The DevExpress Spreadsheet Document API and WinForms / WPF Spreadsheet controls now support the XLSB (BIFF12) format. You can load and save documents using this format.
- Excel 5.0/95 Workbook (BIFF5) Support - With this release, the WinForms and WPF Spreadsheet controls and Spreadsheet Document API can import documents using the Excel 5.0/95 Binary file format (BIFF5).
- Status Bar - v19.2 introduces a Status Bar for the WinForms and WPF Spreadsheet controls. The status bar allows you to zoom (in or out) the current worksheet and displays the following summary information:
- Number of selected cells (Count)
- Number of selected cells with numerical values (Numerical Count)
- Average
- Minimum value (MIN)
- Maximum value (MAX)
- Sum
- The integrated Customize Status Bar context menu allows users to display or hide status bar entries. This can also be done in code using the new API.
Themes
- Office 2019 High-Contrast Theme - This release includes a new Microsoft Outlook-inspired High-Contrast theme.
- Palette Theme Cache - With v19.2, you can cache the current palette theme's assembly to load the theme faster in future application runs. The Theme class API allows you to specify the location of cached files and clear the cache when necessary.
- Theme Designer - Visual Tree and Properties Windows - In v19.2, the WPF Theme Designer introduces Visual Tree and Properties Windows. These new windows allow you to locate a UI element and its properties within XAML more quickly.
Windows UI
- Hamburger Menu - UI Enhancements - Hamburger Menu UI elements now support the Reveal Highlight effect - an appearance option designed to mimic the look and feel of Windows UI applications. To activate Reveal Highlighting, enable the HamburgerMenu.ShowRevealHighlightEffect option. Once enabled, the selected Hamburger Menu item displays a vertical bar on its left side to stand out from other items.
- Fluent Design - Reveal Highlight (CTP) - You can now add the Reveal Highlight effect to templates used by any WPF control. The RevealHighlightOptions class automatically implements 'Reveal hover' and 'Reveal border' effects based on 'Background' and 'BorderBrush' property values.
- Fluent Design - Acrylic Window (CTP) - The Themed Window now supports the Acrylic effect (inspired by Fluent Design's Acrylic material). Acrylic turns the entire window (including the title bar) translucent, adding depth between application windows. The AcrylicColor and AcrylicOpacity properties allow you to specify the Acrylic effect's color and opacity.
↧
October 25, 2019, 7:19 am
New Diagram controlAdds new diagram control.
Features
ASP.NET Controls
New Diagram (CTP) - The new ASP.NET Diagram for WebForms allows you to incorporate information-rich diagrams, flow charts and organization charts with ease. The Diagram control is available as a community technology preview. Features include:
- 35+ Predefined Shapes
- Custom Shapes
- Bind to Any External Data
- Shape Sizing and Drag-and-Drop
- Collapsible Containers
- Auto Layout
- ReadOnly Mode
- Configurable Page Settings
- Export to SVG, PNG and JPEG
- Zoom and Auto Zoom
- Full Screen and Simple View Modes
CardView
- Edit Form Layout - Customization API - New server-side and client-side API allows you to customize the Edit Form at runtime. You can now specify item caption and toggle item/group visibility on the fly.
- Configurable Data Export - The new BeforeExport event allows you to configure export settings in code.
- Real-Time Summary Computation Updates in Batch Edit Mode - The Data Grid, CardView and Vertical Grid controls can now recalculate summaries on the client-side in batch edit mode. Summaries now reflect all real-time changes to grid cell values.
Charting
- Waterfall - This release includes a new Waterfall chart type. Waterfall charts can help visualize positive and negative changes to values across a given time period.
- Box Plot - This release includes a new Box Plot chart type. Box Plot charts help you visualize data distribution across a six number summary (minimum, first quartile, median, third quartile, maximum and mean). Any data not included between minimum and maximum values are plotted as an outlier with a small circle.
- TimeSpan Axis Scale Support - v19.2 introduces full support for TimeSpan scales. You can plot your TimeSpan data as-is or specify a custom aggregation mode. TimeSpan data can be mapped to an X-Axis, Y-Axis or both.
- New Default Appearance Schema - v19.2 updates the default appearance schema for the WebForms and MVC Chart controls.
Gantt (CTP)
- Node Editing - The following edit actions are available:
- Resize and modify tasks
- Change dependencies between tasks
- Edit cell values within the Tree List region. The component immediately saves changes on the server and updates the Gantt chart when cell values change.
- Change History - The DevExpress ASP.NET Gantt control stores changes made by an end-user. Changes can be rolled back if necessary.
- Real-time Scaling - The DevExpress ASP.NET Gantt control allows you to browse data across various levels of detail. Hold the CTRL key and rotate your mouse scroll wheel to zoom (in or out).
GridView
- Edit Form Layout - Customization API - New server-side and client-side API allows you to customize the Edit Form at runtime. You can now specify item caption and toggle item/group visibility on the fly.
- Configurable Data Export - The new BeforeExport event allows you to configure export settings in code.
- Real-Time Summary Computation Updates in Batch Edit Mode - The Data Grid, CardView and Vertical Grid controls can now recalculate summaries on the client-side in batch edit mode. Summaries now reflect all real-time changes to grid cell values.
- New API
- ToolbarItem.VisibleInBatchEditPreviewChanges - Allows you to display custom toolbar items when in Preview Changes mode.
- AdaptiveDetailLayoutProperties.Items.AddCommandItem - Allows you to include Command Column items into a customized Adaptive Detail Layout.
- SettingsHeaderFilter.DateRangePickerSettings.PickerType - Specifies picker type within the Data Edit column’s Header Filter.
- The Columns.Add method overload allows you to create cell bands in MVC using model-based properties and lambda expressions.
Grid Lookup
- The Grid Lookup now offers improved data selection performance when used in server mode (when the component loads the first time on a page).
File Manager
- FileManager can now display folders with the same name when connected to a cloud service.
Pivot Grid
- Aggregation at Any Level - This release includes an optimized Pivot Grid calculation engine for WinForms, WPF and ASP.NET. This new engine provides a more versatile summary expression function. The scope of the function is unbound fields. The Aggr function aggregates data with a specific summary function against a specific set of dimensions. Aggr functions can be nested as needed (you can easily create the desired aggregation level within the Pivot Grid control). The Aggr function has the following syntax: Aggr(summaryExpression, dimension1, dimension2, ...) The first argument is a summary expression calculated against a data source field. It is followed by a set of dimensions whose values are grouped to calculate summaries for the first argument.
- Window Calculations - You can now specify the following window calculation options:
- Running Totals
- Moving Calculation
- Rank
- Difference
- Percent Of Total
- Custom Window Expression
- The new object model includes the following classes:
- RunningTotalBinding
- MovingCalculationBinding
- RankBinding
- DifferenceBinding
- PercentOfTotalBinding
- WindowExpressionBinding
- These enhancements are available when the new Optimized calculation engine is activated.
- Direct Data Access in Client Mode - The data engine loads data to local in-memory storage. This local storage is optimized for frequent calculations with typed data sets and guarantees data integrity. Some large data sets, however, may require require too large a memory footprint (which can, in turn, slow down an application). With this release, it adds a DirectDataAccessInClientMode option. When the DirectDataAccessInClientMode option is enabled, the calculation engine does not upload source data to temporary storage. This avoids performance degradation in Client mode when working with large volumes of data (and when frequent re-calculations are unnecessary). This option cannot be used if using the PivotGrid in Legacy mode.
TreeList
- Configurable Data Export - The new BeforeExport event allows you to configure export settings in code.
VerticalGrid
- Configurable Data Export - The new BeforeExport event allows you to configure export settings in code.
- Real-Time Summary Computation Updates in Batch Edit Mode - The Data Grid, CardView and Vertical Grid controls can now recalculate summaries on the client-side in batch edit mode. Summaries now reflect all real-time changes to grid cell values.
Accessibility
- Accessibility enhancements allow the GridView, TreeView, File Manager and DateEdit components to better address W3C guidelines and standards.
Data Validation
- To improve data integrity, Data Range validation checks data editor values (including editors in the grid's edit form) even if values stay the same.
- The SpinEdit, ComboBox and RadioButtonList editors now support null value validation.
ASP.NET Core Controls
ASP.NET Core 3 Support
- The ASP.NET Core Controls are fully compatible with ASP.NET Core 3. This release has also updated the Visual Studio 'Add DevExtreme to the Project' command. It is now compatible with Endpoint routing and the new JSON serialization option introduced in ASP.NET Core 3.
New Gantt (CTP) - The new ASP.NET Core Gantt control is available as a community technology preview. Built-in features include:
- Resize and modify tasks
- Change dependencies between tasks
- Edit cell values within the TreeList region
- Change history
- Region resizing
- Real-time scaling
- Task selection API
Diagram (CTP)
- Images within Shapes - The Diagram control now provides shapes with images that were specially designed for use in OrgCharts. You can associate an image with the shape via a database or the control's UI. You can also add images to custom shapes.
- Shape Containers - New shape types - horizontal and vertical containers - allow you to combine other shapes within a "container". The Web Diagram component supports stacked containers and ships with expand and collapse functionality.
- New Data Binding Capabilities - Now ship advanced data binding options for shape settings. You can bind all shape properties including shape and connectors style, shape image URL, position, and size to a database.
- Full Screen Mode - The Diagram now supports fullscreen mode. You can add a corresponding toolbar command or use the 'fullscreen' property to enable fullscreen mode within your web app.
- Read Only Mode - Read only mode protects the Diagram from edit operations. Use the 'readOnly' property to enable this diagram option.
- Simple View - When you activate the new Simple View mode, the Web Diagram removes gray document borders and its content fully consumes available screen real-estate.
- Zoom - With this release, your end-users can zoom the diagram as needed. To change zoom level, use the 'Zoom Level' editor on the Properties panel or CTRL+Mouse scroll wheel combination. Select the 'Auto Zoom' check box to fit the diagram within the page.
- UI Customization - The new API allows you to toggle the visibility and specify the content of the following UI elements:
- Context Menu (contextMenu),
- Properties Panel (propertiesPanel),
- Toolbar (toolbar)
- Toolbox (toolbox)
Data Grid and TreeList
- Data Grid - Export to Excel API Enhancements (CTP)
- Only export selected rows
- Export with source column width
- In addition, the 'group', 'header', 'groupFooter', and 'totalFooter' are now exported with highlighted text (bold).
- Also extended the 'CustomizeCell' callback argument set. You can access all properties of the DataGridCell object within the callback.
- Reorder Records/Nodes - End-users can now reorder Data Grid rows and TreeList nodes via drag-and-drop.
- Asynchronous API Enhancements - With this release, it enables asynchronous event handlers for the following events:
- setCellValue
- initNewRow
- rowValidating
File Manager (CTP)
- New Progress and Status UI - Introduced the following UI elements to display the progress and status of file operations:
- Popup notification messages
- Enhanced 'Refresh' toolbar item
- Operation progress side panel
- Integrated Splitter - The built-in splitter control allows you to resize the File Manager's navigation panel.
- File Validation Enhancements - Enhanced the validation capabilities of the File Manager. You can now specify allowed file extensions using the new 'allowedFileExtensions' option. The new 'upload.maxFileSize' option allows you to specify the maximum file size (maximum size allowed).
- Download Files - You can now allow your users to download files. Use the new 'endpointUrl' option to specify your server-side handler endpoint used for download operations.
- Toolbar and Context Menu Customization - You can now customize the File Manager's toolbar and context menu via two new options ('toolbar' and 'contextMenu').
- Custom File Providers - You can now implement a custom File Provider that allows you to connect the client-side File Manager to any custom file management backend.
- Direct File Upload to Cloud Providers - You can now upload files directly to Azure, Amazon and other cloud providers. Use the FileUploader's 'uploadChunk' and 'abortUpload' callbacks.
- Access File Content on the Client-Side - With this release, you can obtain binary file content info within the web browser using the 'FileProvider.getItemContent' method.
Rich Text Editor
- RTF Support - The ASP.NET Core Rich Text Editor can now open and save RTF files.
- Localization - With this release, you can use the DevExpress Localization Service to customize resources for the ASP.NET Core Rich Text Editor and Spreadsheet controls.
Spreadsheet
- Localization - With this release, you can use the DevExpress Localization Service to customize resources for the ASP.NET Core Rich Text Editor and Spreadsheet controls.
Data Visualization
- Discrete Aggregation - This release includes a new 'aggregateByCategory' option. When used, this option changes the way the Chart control aggregates discrete data. If set to "true", the chart control aggregates series points for the same category.
- Display Negative Values for Logarithmic Scales - Datasets that contain rapidly growing values with negative and/or zero values can now be visualized within the logarithmic axis.
- Custom Legend Item Markers - You can now use a custom template to render Chart legend markers.
- Template-Based Tooltip Customization - You can now use templates to customize chart tooltips.
- Custom Annotations - The Chart control now supports custom annotations. You can use a template to render the desired content within the annotation container.
- Custom Text Inside a Donut - With this release, you can include custom SVG markup inside a Donut chart (your content will be placed at the center of Donut/Pie chart).
- Manage Chart Pane Size - You can now control the size of chart panes. Both pixel and percentage units are supported.
- Polar Chart with Zoom - To help you create the best possible interactive user experience, this release adds zoom support to the Polar Chart.
- VectorMap Coordinate Translation API - Introduced two new methods for coordinate translation (VectorMap). With this new API, your apps can now support more sophisticated map interaction usage-scenarios.
Themes
- Custom CSS Bundles - You can now bundle CSS styles for UI components used within your application. You can also create multiple bundles of different DevExtreme Color Swatches (which contain different component sets).
UI Controls
- Asynchronous Validation - Added a new Asynchronous Validation Rule to the Validation Engine. You can now use the [Remote] attribute to perform remote data validation by calling server action methods. When data validation is in progress, DevExtreme data editors display an animation indicator (the indicator turns into a "result" icon once validation is complete).
- Data Form - Dynamic Updates without a Full Re-Render - You can customize DevExtreme Data Form item(s) within a group (add/remove/display/hide) without re-rendering the entire form.
- New Drag-and-Drop Utilities - Now ship a drag-and-drop utilities library so you can implement custom drag-and-drop functionality within your web app.
- Cross-Component Drag & Drop API - This new API allows you to incorporate cross-component drag & drop support.
- Floating Button Enhancements - Floating Action Button enhancements include:
- Add a label to an action
- Hide an action
- Reorder actions
- Expand the speed dial menu in a different direction
Visual Studio Integration
- Form Scaffolding Wizard - Added a Form to the list of controls supported by the Visual Studio Scaffolding Wizard. You can now quickly generate forms based on model classes.
- DevExtreme Angular Documentation
- DevExtreme-based ASP.NET Core Documentation
- DevExtreme ASP.NET MVC Documentation
- Async Support in API Controller Scaffolding Wizard - Improved API Controller Scaffolding Wizard to better leverage teh asynchronous capabilities of Entity Framework and Entity Framework Core. The API Controller Scaffolding Wizard can now generate asynchronous (async-await) code for controller actions.
↧
October 25, 2019, 7:21 am
DevExpress UniversalMajor enhancements for JavaScript (Angular, React, Vue), ASP.NET Core, ASP.NET, WPF and Reporting.
Features
DevExpress has released a major update across their entire product range.
↧
October 25, 2019, 7:30 am
DevExpress DXperienceMajor enhancements for JavaScript (Angular, React, Vue), ASP.NET Core, ASP.NET, WPF and Reporting.
Features
DevExpress has released a major update across their entire product range.
↧
↧
November 6, 2019, 4:00 am
Syncfusion Essential Studio ASP.NET CoreImproves Calendar, Document Editor and PDF Viewer controls.
Features
Calendar
- Now, month name, day name are capitalized for all localizations.
DateTimePicker
- Now, you can set the server time zone using serverTimezoneOffset property.
Document Editor
- Added property to retrieve bookmarks on selection.
- Added API for restrict editing.
- Added API for selection.
PDF Viewer
- Exposed the unique ID in the annotationAdd event arguments.
Pivot Table
- Provided conditional expression support to create calculated fields.
- Improved performance of virtual scrolling while adding or removing fields and moving fields to any axis.
Uploader
- Now, the file upload UI is changed for synchronous uploads.
↧
November 6, 2019, 4:02 am
Syncfusion Essential Studio ASP.NET MVCImproves Calendar, Document Editor and PDF Viewer controls.
Features
Calendar
- Now, month name, day name are capitalized for all localizations.
DateTimePicker
- Now, you can set the server time zone using serverTimezoneOffset property.
Document Editor
- Added property to retrieve bookmarks on selection.
- Added API for restrict editing.
- Added API for selection.
PDF Viewer
- Exposed the unique ID in the annotationAdd event arguments.
Pivot Table
- Provided conditional expression support to create calculated fields.
- Improved performance of virtual scrolling while adding or removing fields and moving fields to any axis.
Uploader
- Now, the file upload UI is changed for synchronous uploads.
↧
November 6, 2019, 4:20 am
Syncfusion Essential Studio for JavaScriptImproves Calendar, Chart and Document Editor controls.
Features
Calendar
- Now, month name, day name are capitalized for all localizations.
Chart
- Added support for rendering background images.
DateTimePicker
- Now, you can set the server time zone using serverTimezoneOffset property.
Document Editor
- Added property to retrieve bookmarks on selection.
- Added API for restrict editing.
- Added API for selection.
File Manager
- Support has been provided to include a custom message in the AccessRule class using message property.
PDF Viewer
- Exposed the unique ID in the annotationAdd event arguments.
QueryBuilder
- Provided Not Contains, Not Starts With and Not Ends With operator support.
Uploader
- Now, the file upload UI is changed for synchronous uploads.
↧
November 6, 2019, 4:41 am
Syncfusion Essential Studio WPFImproves PDF Viewer and Scheduler controls.
Features
PDF Viewer
- Added support for tracking printing progress of PDF documents.
Scheduler
- Added event to handle appointment deletion.
- Added event to handle edit actions for appointments.
↧
↧
November 6, 2019, 4:44 am
Syncfusion Essential Studio EnterpriseAll of Syncfusion's user interface, reporting, and business intelligence components and libraries in one comprehensive suite. Latest Service Pack release.
Features
Syncfusion has released a Service Pack update across their Essential Studio product range.
↧
November 11, 2019, 9:26 am
Smart HTML ElementsAdds the ability to export images and print from Smart.Grid control.
Features
- Added React demos for all Web Components.
- Added Vue demos for all Web Components.
- Added Smart.Grid printing.
- Added Smart.Grid image exporting to .PNG and .JPEG.
- Added Smart.Grid data localization.
- Improved API documentation for all Web components.
- Smart.Grid - You can now preserve column sorting on datasource update.
- Smart.Grid API - Introduced columnResize and rowResize events, onCellUpdate, onRowUpdate callback function.
- Improved framework loop rendering with the *items property. It can now be bound not only to an Array, but also to a Number now. This means that new HTMLElements will be automatically created depending on a numeric value.
↧
November 18, 2019, 2:25 am
Wijmo adds TransposedGrid control.Adds FlexGrid Cell Templates for React and Vue.
Features
Wijmo Supports Angular 9 and the Ivy Compiler
- Adds support for Angular 9 and the Ivy Compiler - start building even faster enterprise applications with the Ivy Compiler.
FlexGrid Enhancements
- Adds FlexGrid Cell Templates to React and Vue - Easily customize any cell in FlexGrid. Cell Templates allow for limitless templates with declarative markup and binding expressions in any cell of the grid.
- Two-way Bindings in Wijmo Vue Components - simplifies the creation of input forms. Vue offers two different syntaxes for declaring two-way bindings, the v-model directive, and the sync binding modifier. Wijmo for Vue input components support both of them, so you can choose between them depending on your needs.
- PureJS FlexGrid Cell Templates - GrapeCity added a new API to their pure JS FlexGrid. The Column class has a new cellTemplate property that allows custom rendering of data cells without using the formatItem event. Column.cellTemplates are much simpler than the Angular, React or Vue Cell Templates. They only allow for a template literal string to be declared. You can put HTML elements in it or even binding expressions that will be parsed by the glbz method and rendered in the cells.
- FlexGrid Multi-Column Sort - Changed the allowSorting property to an enumeration with the following values:
- AllowSorting.None: Users cannot sort the grid by clicking the column headers. This is the same as setting allowSorting to false in previous versions.
- AllowSorting.SingleColumn: Users may sort the grid by a single column at a time. Clicking the column header sorts the column or flips the sort direction. Ctrl+Click removes the sort. This is the same as setting allowSorting to true in previous versions.
- AllowSorting.MultiColumn: Users may sort the grid by multiple columns at a time. Clicking the column header sorts the column or flips the sort direction. Ctrl+Click removes the sort for that column. Ctrl+Shift+Click removes all sorts. When sorting on multiple columns, the grid shows the sort order in the column headers, next to the sort direction glyph.
- FlexGrid Pinned Columns - The FlexGrid always supported freezing rows and columns through code but did not expose a UI for controlling this feature. This release adds the allowPinning property that adds pin glyphs to the column headers (clicking the pin freezes or un-freezes the column).
- FlexGrid Full-text Search - The FlexGrid has always supported column-based, Excel-style filtering using the FlexGridFilter component. This release adds a new wijmo.grid.search module with aFlexGridSearch control that provides a full-text search/filter interface. As users type into the FlexGridSearch control, it filters the items based on the search text and automatically highlights the matches.
- TransposedGrid - In regular grids, each item is represented by a row with columns that represent the item properties. In transposed grids, each item is represented by a column with rows that represent the item properties. GrapeCity have added a new wijmo.grid.transposed module with a TransposedGrid control where data items are shown as columns and their properties as rows. Customers have used FlexGrid's API to create similar views, but the new TransposedGrid control makes it even easier.
- Saving CSV Files - Two new features have been added to make saving as CSV files even easier and more powerful:
- Added a saveFile method to Wijmo core so you can easily save text files without having to copy the same boilerplate code over and over.
- The grid's getClipString method now has an options parameter that allows you to specify exactly how you want the clip string to be generated. The options available are listed below:
- ClipStringOptions.Default: Use default options (tabs as cell separators, formatted/visible/unquoted cells). This is the format used internally when copying/pasting to the clipboard.
- ClipStringOptions.CSV: Use commas as cell separators (CSV format). This is the default format used for exporting CSV files.
- ClipStringOptions.QuoteAll: Quote all cells. Instead of adding quotes only to cells that contain commas and quotes, wrap all cells in quotes. This makes the output file a little easier to parse.
- ClipStringOptions.SkipMerged: Skip cells that have been merged over (like Excel). This makes the output file a little easier to read in some cases.
- ClipStringOptions.Unformatted: Export unformatted values. This format retains the full precision of numeric values, as opposed to saving only the formatted values.
- ClipStringOptions.InvisibleRows: Include invisible and collapsed rows in the output. By default, invisible and collapsed rows are not included.
- ClipStringOptions.InvisibleColumns: Include invisible columns in the output. By default, invisible columns are not included.
- ClipStringOptions.InvisibleCells: Include invisible rows and columns in the output.
- Other FlexGrid Enhancements:
- Collapsible Column Groups: Added the ability to create collapsible column groups declaratively. This is done by setting the columns property (or the columnGroups property) to an array containing column definitions where the definitions contain a 'columns' collection of child columns.
- Added a defaultTypeWidth static property that allows specifying the default width for auto-generated grid columns based on their data types.
- Improved Clipboard Support: Added a copyHeaders property that allows you to specify whether the grid should include row and/or column headers when copying data to the clipboard.
- RowDetail Frozen Cell Support: Allow detail cells to span across frozen boundaries
MultiRow Enhancements
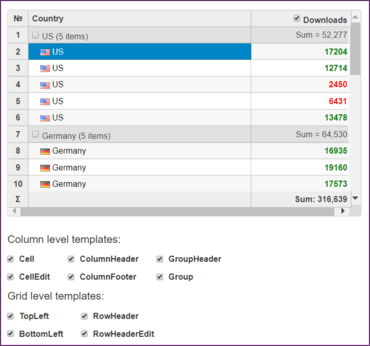
- MultiRow Aggregated Groups: Added a multiRowGroupHeaders property that allows headers with multiple header rows (especially useful for displaying aggregates)
- MultiRow Column Header Layouts: Added a headerLayoutDefinition property that allows you to define custom layouts for the column headers
FlexChart Enhancements
- StepLine Chart - most commonly used to visualize change at specific points in time. They are useful for seeing the size of the change in value as well as patterns in change over time. GrapeCity recently added new Step, StepSymbols and StepArea chart types to the FlexChart control.
CollectionView Filters
- Added a filters property that contains an array of filter functions. This allows you to chain filters with multiple, independent filter functions.
Improved Typings
- GrapeCity have made some big improvements to their type information in Wijmo. These changes will make Wijmo easier to use and it will help you find bugs in your code much more easily.
Other Enhancements
- Added type information to several callbacks and properties that used to be of type 'any'.
- Added generic types to the sender and arguments of the Event class.
- Added a generic type to the CollectionView and ObservableArray classes.
- The additional type information provides improved compile-time error-checking and IntelliSense,so you can write better code faster.
Fixes
- [FlexChart] Fixed issue with incorrect label position for data points with zero value. (TFS 397617).
- [FlexChart] Fixed issue with incorrect gradient colors when URL contains ending slash. (TFS 397809).
- [FlexChart] Improved background handling when exporting chart to png/jpg. (TFS 364426).
- [FlexChart] Fixed issue with intermediate total labels of Waterfall chart. (TFS 400091).
- [FlexChart] The chart tooltip works correctly when mouse pointer is over the tooltip. (TFS 402702).
- [FlexChart] Improved calculation of automatic axis limits for bubble chart. (TFS 336715).
- [FlexChart] X-axis limits can be set for Stacked 100% chart. (TFS 402952).
- [FlexChart] Fixed issue with incorrect tooltips for multiple pie charts. (TFS 400338).
- [FlexChart] Fixed error when rendering funnel chart with data source that has null values. (TFS 385211).
- [JP][FlexGrid][Pdf] Unable to export to PDF when column width is smaller than 7. (TFS 398564).
- [FlexSheet][Chrome] Page is scrolled on clicking FlexSheet that is partially seen in the view. (TFS 398682).
- [FlexGrid] [PdfExport] The FlexGrid resizes on the DOM after exporting to PDF. (TFS 396132).
- [FlexSheet] Column header of data mapped cells change to auto generated column header when converting to table. (TFS 400219).
- [FlexSheet] Column header can be cut and script error occurs when pasting null value at second time. (TFS 400190).
- [FlexSheet] Script error occurs when deleting group data rows in certain scenario. (TFS 399570).
- [FlexSheet] Sort indicator disappeared after navigating to another sheet. (TFS 399979).
- [FlexSheet] Script error occurs after insert or delete a row when add bound sheet and use 'initialize' method to set 'itemsSource' property. (TFS 398847).
- [FlexSheet] Filtering cannot be cleared after filtered by the formula value. (TFS 396572).
- [Angular/MultiSelect] Fixed problem with the checkedItems property 'required' validation in forms. (TFS 402058).
- [FlexSheet] Improper table header value shown after converting a cell range including sheet column header to table. (TFS 395550).
- [FlexSheet][Filter]All values are not shown in filter by value if some values are merged. (TFS 392169).
- [FlexSheet] Column-header row of bound sheet does not show after delete all rows, undo and redo the action. (TFS 402054).
- [FlexGrid] [PDF] Some of the checkboxes of boolean column are not rendered in PDF. (TFS 401965).
- [FlexSheet][Chrome] New sheet cannot add at first time when 'stickyHeaders' is set as 'true'. (TFS 396185).
- [FlexSheet] Performance issue due to custom function. (TFS 352914).
- [Angular/WjTooltip] The wjTooltip property alway returns an undefined value.
- [FlexSheet] Column cannot resize immediately and selection does not show correctly when resizing a column from new sheet. (TFS 403862).
- [FlexSheet] Filter editor cannot open and script error occurs when opening filter editor of newly added sheet. (TFS 403839).
- [FlexSheet][Benchmark sample] Unlike previous build, loading data takes very long time and browser is not responding when data size is more than 500. (TFS 261309).
- [FlexSheet] Rows cannot be deleted properly when setting 'allowAddNew' property as 'true'. (TFS 403947).
- [FlexSheet] 'Insert Row', 'Delete Rows' and 'Convert To Table' context menu items do not work in Bound sheet. (TFS 404836).
↧
November 18, 2019, 2:25 am
FlexGrid Cell Templates.Adds FlexGrid Cell Templates for React and Vue.
Features
Wijmo Supports Angular 9 and the Ivy Compiler
- Adds support for Angular 9 and the Ivy Compiler - start building even faster enterprise applications with the Ivy Compiler.
FlexGrid Enhancements
- Adds FlexGrid Cell Templates to React and Vue - Easily customize any cell in FlexGrid. Cell Templates allow for limitless templates with declarative markup and binding expressions in any cell of the grid.
- Two-way Bindings in Wijmo Vue Components - simplifies the creation of input forms. Vue offers two different syntaxes for declaring two-way bindings, the v-model directive, and the sync binding modifier. Wijmo for Vue input components support both of them, so you can choose between them depending on your needs.
- PureJS FlexGrid Cell Templates - GrapeCity added a new API to their pure JS FlexGrid. The Column class has a new cellTemplate property that allows custom rendering of data cells without using the formatItem event. Column.cellTemplates are much simpler than the Angular, React or Vue Cell Templates. They only allow for a template literal string to be declared. You can put HTML elements in it or even binding expressions that will be parsed by the glbz method and rendered in the cells.
- FlexGrid Multi-Column Sort - Changed the allowSorting property to an enumeration with the following values:
- AllowSorting.None: Users cannot sort the grid by clicking the column headers. This is the same as setting allowSorting to false in previous versions.
- AllowSorting.SingleColumn: Users may sort the grid by a single column at a time. Clicking the column header sorts the column or flips the sort direction. Ctrl+Click removes the sort. This is the same as setting allowSorting to true in previous versions.
- AllowSorting.MultiColumn: Users may sort the grid by multiple columns at a time. Clicking the column header sorts the column or flips the sort direction. Ctrl+Click removes the sort for that column. Ctrl+Shift+Click removes all sorts. When sorting on multiple columns, the grid shows the sort order in the column headers, next to the sort direction glyph.
- FlexGrid Pinned Columns - The FlexGrid always supported freezing rows and columns through code but did not expose a UI for controlling this feature. This release adds the allowPinning property that adds pin glyphs to the column headers (clicking the pin freezes or un-freezes the column).
- FlexGrid Full-text Search - The FlexGrid has always supported column-based, Excel-style filtering using the FlexGridFilter component. This release adds a new wijmo.grid.search module with aFlexGridSearch control that provides a full-text search/filter interface. As users type into the FlexGridSearch control, it filters the items based on the search text and automatically highlights the matches.
- TransposedGrid - In regular grids, each item is represented by a row with columns that represent the item properties. In transposed grids, each item is represented by a column with rows that represent the item properties. GrapeCity have added a new wijmo.grid.transposed module with a TransposedGrid control where data items are shown as columns and their properties as rows. Customers have used FlexGrid's API to create similar views, but the new TransposedGrid control makes it even easier.
- Saving CSV Files - Two new features have been added to make saving as CSV files even easier and more powerful:
- Added a saveFile method to Wijmo core so you can easily save text files without having to copy the same boilerplate code over and over.
- The grid's getClipString method now has an options parameter that allows you to specify exactly how you want the clip string to be generated. The options available are listed below:
- ClipStringOptions.Default: Use default options (tabs as cell separators, formatted/visible/unquoted cells). This is the format used internally when copying/pasting to the clipboard.
- ClipStringOptions.CSV: Use commas as cell separators (CSV format). This is the default format used for exporting CSV files.
- ClipStringOptions.QuoteAll: Quote all cells. Instead of adding quotes only to cells that contain commas and quotes, wrap all cells in quotes. This makes the output file a little easier to parse.
- ClipStringOptions.SkipMerged: Skip cells that have been merged over (like Excel). This makes the output file a little easier to read in some cases.
- ClipStringOptions.Unformatted: Export unformatted values. This format retains the full precision of numeric values, as opposed to saving only the formatted values.
- ClipStringOptions.InvisibleRows: Include invisible and collapsed rows in the output. By default, invisible and collapsed rows are not included.
- ClipStringOptions.InvisibleColumns: Include invisible columns in the output. By default, invisible columns are not included.
- ClipStringOptions.InvisibleCells: Include invisible rows and columns in the output.
- Other FlexGrid Enhancements:
- Collapsible Column Groups: Added the ability to create collapsible column groups declaratively. This is done by setting the columns property (or the columnGroups property) to an array containing column definitions where the definitions contain a 'columns' collection of child columns.
- Added a defaultTypeWidth static property that allows specifying the default width for auto-generated grid columns based on their data types.
- Improved Clipboard Support: Added a copyHeaders property that allows you to specify whether the grid should include row and/or column headers when copying data to the clipboard.
- RowDetail Frozen Cell Support: Allow detail cells to span across frozen boundaries
MultiRow Enhancements
- MultiRow Aggregated Groups: Added a multiRowGroupHeaders property that allows headers with multiple header rows (especially useful for displaying aggregates)
- MultiRow Column Header Layouts: Added a headerLayoutDefinition property that allows you to define custom layouts for the column headers
FlexChart Enhancements
- StepLine Chart - most commonly used to visualize change at specific points in time. They are useful for seeing the size of the change in value as well as patterns in change over time. GrapeCity recently added new Step, StepSymbols and StepArea chart types to the FlexChart control.
CollectionView Filters
- Added a filters property that contains an array of filter functions. This allows you to chain filters with multiple, independent filter functions.
Improved Typings
- GrapeCity have made some big improvements to their type information in Wijmo. These changes will make Wijmo easier to use and it will help you find bugs in your code much more easily.
Other Enhancements
- Added type information to several callbacks and properties that used to be of type 'any'.
- Added generic types to the sender and arguments of the Event class.
- Added a generic type to the CollectionView and ObservableArray classes.
- The additional type information provides improved compile-time error-checking and IntelliSense,so you can write better code faster.
Fixes
- [FlexChart] Fixed issue with incorrect label position for data points with zero value. (TFS 397617).
- [FlexChart] Fixed issue with incorrect gradient colors when URL contains ending slash. (TFS 397809).
- [FlexChart] Improved background handling when exporting chart to png/jpg. (TFS 364426).
- [FlexChart] Fixed issue with intermediate total labels of Waterfall chart. (TFS 400091).
- [FlexChart] The chart tooltip works correctly when mouse pointer is over the tooltip. (TFS 402702).
- [FlexChart] Improved calculation of automatic axis limits for bubble chart. (TFS 336715).
- [FlexChart] X-axis limits can be set for Stacked 100% chart. (TFS 402952).
- [FlexChart] Fixed issue with incorrect tooltips for multiple pie charts. (TFS 400338).
- [FlexChart] Fixed error when rendering funnel chart with data source that has null values. (TFS 385211).
- [JP][FlexGrid][Pdf] Unable to export to PDF when column width is smaller than 7. (TFS 398564).
- [FlexSheet][Chrome] Page is scrolled on clicking FlexSheet that is partially seen in the view. (TFS 398682).
- [FlexGrid] [PdfExport] The FlexGrid resizes on the DOM after exporting to PDF. (TFS 396132).
- [FlexSheet] Column header of data mapped cells change to auto generated column header when converting to table. (TFS 400219).
- [FlexSheet] Column header can be cut and script error occurs when pasting null value at second time. (TFS 400190).
- [FlexSheet] Script error occurs when deleting group data rows in certain scenario. (TFS 399570).
- [FlexSheet] Sort indicator disappeared after navigating to another sheet. (TFS 399979).
- [FlexSheet] Script error occurs after insert or delete a row when add bound sheet and use 'initialize' method to set 'itemsSource' property. (TFS 398847).
- [FlexSheet] Filtering cannot be cleared after filtered by the formula value. (TFS 396572).
- [Angular/MultiSelect] Fixed problem with the checkedItems property 'required' validation in forms. (TFS 402058).
- [FlexSheet] Improper table header value shown after converting a cell range including sheet column header to table. (TFS 395550).
- [FlexSheet][Filter]All values are not shown in filter by value if some values are merged. (TFS 392169).
- [FlexSheet] Column-header row of bound sheet does not show after delete all rows, undo and redo the action. (TFS 402054).
- [FlexGrid] [PDF] Some of the checkboxes of boolean column are not rendered in PDF. (TFS 401965).
- [FlexSheet][Chrome] New sheet cannot add at first time when 'stickyHeaders' is set as 'true'. (TFS 396185).
- [FlexSheet] Performance issue due to custom function. (TFS 352914).
- [Angular/WjTooltip] The wjTooltip property alway returns an undefined value.
- [FlexSheet] Column cannot resize immediately and selection does not show correctly when resizing a column from new sheet. (TFS 403862).
- [FlexSheet] Filter editor cannot open and script error occurs when opening filter editor of newly added sheet. (TFS 403839).
- [FlexSheet][Benchmark sample] Unlike previous build, loading data takes very long time and browser is not responding when data size is more than 500. (TFS 261309).
- [FlexSheet] Rows cannot be deleted properly when setting 'allowAddNew' property as 'true'. (TFS 403947).
- [FlexSheet] 'Insert Row', 'Delete Rows' and 'Convert To Table' context menu items do not work in Bound sheet. (TFS 404836).
↧
↧
November 19, 2019, 10:24 am
Multi Day View Mode.Adds ability to set and style non-working hours for DayView and MultiDayView in Calendar.
Features
- Calendar
- Added API to set and style non-working hours for DayView and MultiDayView.
- DataForm
- Implemented ability to get initially collapsed groups.
- SideDrawer
- Exposed TouchTargetThreshold property. Added a feature which allows users to control how far from the edge the gestures for opening the SideDrawer should be respected.
Fixes
- Calendar
- [UWP] Appointments are not redrawn correctly when switching between DayView and MultiDayView.
- Chart
- RadChart's Zoom property could not be set from Xaml.
- Common
- Removed SkiaSharp-dependent assemblies from Lite NuGet package.
- Microsoft Visual Studio hangs trying to open Xamarin Toolbox.
- DataForm
- [Android] DecimalEditor does not receive decimal separator comma.
- [Android] Exception is thrown when value is set to DateTime property using StringToDateTime converter.
- [iOS]: Editor header is cut off if the text is too long.
- [UWP] Numeric and date editors are not aligned properly.
- [UWP] PropertyValidationCompleted is not called in immediate validation mode.
- [UWP] The NegativeFeedback is not showing when ValidateAll method is called.
- DataGrid
- Items that are replaced or moved are not accurately positioned when filtering is applied.
- Items are filtering inaccurately when PropertyChanged is invoked by the visualized business object.
- SDK Browser
- Examples are empty when built with Xamarin.Forms 4.3.
- TreeView
- [iOS] Does not allow to be scrolled when MvvmCross is used.
↧
November 20, 2019, 2:21 am
Infragistics UltimateModernize your WPF, Windows Forms, and ASP.NET MVC applications with .Net Core 3 for Visual Studio 2019.
Features
- Leverage the Latest .NET Core 3 Framework - Modernize your WPF, Windows Forms, and ASP.NET MVC applications with .Net Core 3 for Microsoft Visual Studio 2019.
- Ignite UI for Blazor (preview) - No plugins, no add-ons, no transpilation magic. Just .NET running in the browser. 11 new components including high performing grids, charts, gauges, and maps.
- Dependency Free Web Components - Reusable HTML/JS/CSS components based on web standards with no UI framework dependencies.
- Ignite UI for Angular Tools and Features - Use the Command Line Interface (CLI), Visual Studio Code Toolbox, Tooltip Extension, and extensive Theming and Branding support to deliver feature-rich apps. Additional features include new Grid Advanced Filtering, Enhanced Grid Selection, Multi-view Calendar and a new Theme that mimics Microsoft “fluent” design system. Use the new Tree Map control to visualize flat or hierarchical data with rectangles whose sizes are proportional to the visualized values.
- Easy Theming and Branding for Angular - Go beyond basic Material Design themes and generate automatic color palettes for themes based on a primary and secondary color. Customize typography on an app and component level.
- React Maps, Spreadsheets, and Grids - Display data that contains geographic locations or geo-spatial data on geographic imagery maps. Embed Excel document creation and editing experiences right into your React applications. Use new grid features to take your apps to the next level.
- Native Open Fin FDC3 Adapters for Web - Get performance and security using FDC3 enabled experiences with Infragistics data grids and charts on Angular and React.
- Custom Brand your Entire Application with One Click from Sketch - The new theming and styling plug-in for Sketch lets you custom brand your entire application with one click, then sync to the cloud to share with users and get Angular code.
↧
November 20, 2019, 3:16 am
Web Components Data GridAdds new Web Components and Blazor controls.
Features
- Web Components for Modern Web - New in 19.2, Ignite UI for Web Components gives you encapsulation and the concept of reusable components and custom elements in a dependency-free approach to writing modern web applications.
- ASP.NET Blazor - WebAssembly and SPAs in Microsoft Visual Studio - ASP.NET Blazor is a new framework included in .NET Core 3 for building interactive client-side web UI with .NET. Combine it with Ignite UI for Blazor to create rich UI using your existing C# skills - no need to learn JavaScript or deal with the complexity of modern web development.
- Angular UX - Use the Command Line Interface (CLI), Visual Studio Code WYSIWYG Toolbox, Tooltip Extension and extensive Theming and Branding support to deliver feature-rich apps. Additional features include new Grid Advanced Filtering, Enhanced Grid Selection, Multi-view Calendar and a new Theme that mimics Microsoft "fluent" design system.
- New React Maps, Spreadsheets and Grids
- Display data that contains geographic locations or geo-spatial data on geographic imagery maps.
- Embed Excel document creation and editing experiences right into your React applications.
- Use the Tree Map to show users the relative weighting of data points at more than one level (also known as heatmaps in the financial industry).
- Easy Theming and Branding for Angular - Go beyond basic Material Design themes and generate automatic color palettes for themes based on a primary and secondary color. Customize typography on an app and component level.
- Native Open Fin FDC3 for Angular and React - Get performance and security using FDC3-enabled experiences with Infragistics and OpenFin.
↧